
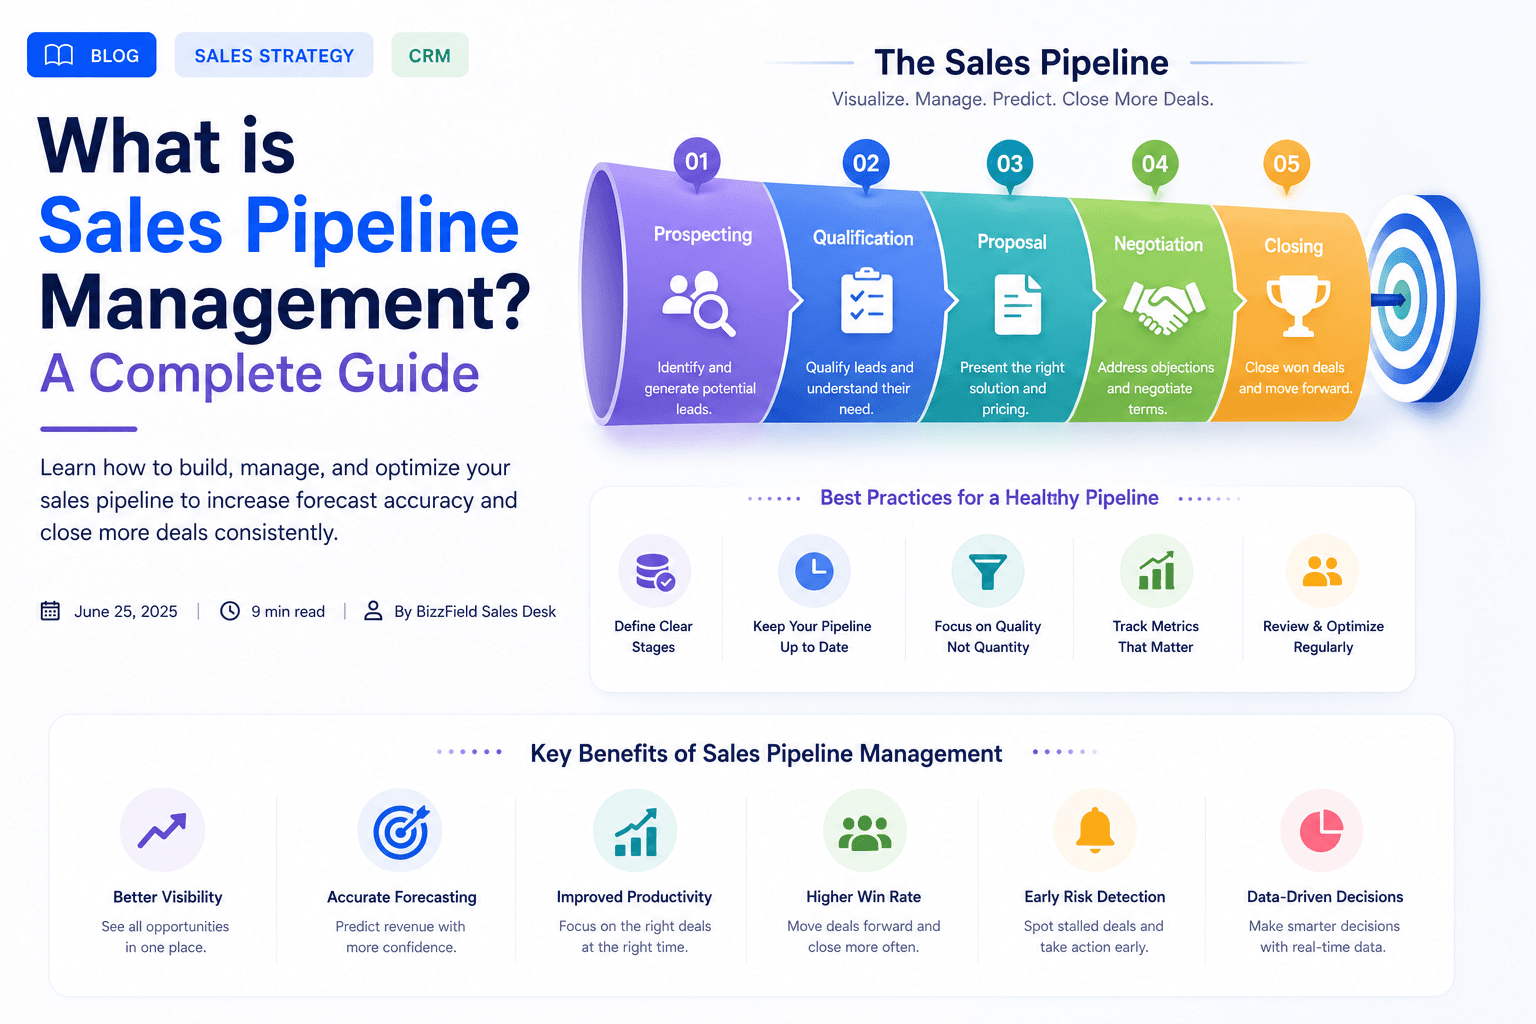
A revenue forecast is only as reliable as the sales pipeline behind it. Get your pipeline stages, deal values, and win probabilities right, and your revenue projections become predictable. Get them wrong, and no financial spreadsheet can prevent missed quarterly targets.
This 2026 tactical guide covers the end-to-end engineering of high-converting sales pipelines. We examine stage definitions, pipeline velocity math, probability-weighted forecasting, multi-pipeline governance, and how sales leaders use visual Kanban management to eliminate deal bottlenecks.
Direct Answer (AEO): What Is Sales Pipeline Management?
Sales Pipeline Management is the systematic process of defining, tracking, and optimizing the stages a prospective deal moves through from initial inquiry to final contract execution and invoicing. It equips sales leaders to monitor deal health in real time, calculate Pipeline Velocity, identify stalled opportunities, and generate accurate weighted revenue forecasts.
1. The Standard B2B Sales Pipeline Stages
A high-performing sales pipeline establishes explicit exit criteria for every stage so representatives cannot advance deals prematurely:
| Pipeline Stage | Win Probability % | Required Exit Criteria / Milestones |
|---|---|---|
| 1. Qualification / Discovery | 10% - 20% | BANT / MEDDPICC budget & decision-maker verified |
| 2. Solution Demo / Scope | 35% - 40% | Technical requirements confirmed with stakeholders |
| 3. Commercial Proposal / Quote | 50% - 60% | Official GST Quotation generated and submitted |
| 4. Negotiation & Legal Review | 80% - 85% | Payment terms, SLA, and contract terms agreed |
| 5. Closed Won / Invoiced | 100% | Signed Sales Order issued; converted to Invoice |
2. The Pipeline Velocity Equation
Pipeline Velocity measures how fast revenue moves through your sales organization per day. Increasing velocity is the most effective lever for accelerated growth:
The Pipeline Velocity Formula
Velocity ($/day) = (Number of Open Deals × Average Deal Value × Win Rate %) ÷ Sales Cycle Length (Days)
Example:If your team handles 50 active deals, with an average deal size of ₹2,00,000, a 30% win rate, and a 60-day average sales cycle:
Velocity = (50 × ₹2,00,000 × 0.30) ÷ 60 = ₹50,000 revenue generated per day.
3. Why Visual Kanban Boards Beat List Views
Flat tabular deal lists show what data exists; a visual Kanban pipeline board instantly reveals where revenue is stuck.
By organizing deals into drag-and-drop columns representing pipeline stages, sales managers can spot operational bottlenecks in seconds — such as ten large quotes sitting in Negotiation for over 30 days without an active follow-up task.
4. Probability-Weighted vs. Unweighted Forecasting
Summing the raw value of all active pipeline opportunities produces a misleading "optimism number". Top revenue leaders calculate Probability-Weighted Expected Value (EV):
Multiply each deal's commercial value by its stage win percentage. In BizzField CRM, every deal card displays both the contract value and the stage-weighted EV, giving executives an accurate forecast of incoming cash flow.
5. Multi-Pipeline Architecture for Enterprise Teams
A single rigid sales process rarely fits an entire business. Different revenue channels require distinct sales pipelines:
- Direct B2B Sales Pipeline:Lead → Qualification → Demo → Quote → Negotiation → Closed Won.
- Distributor / Channel Sales Pipeline:Stockist Inquiry → Territory Margin Approval → Credit Audit → Contract Sign.
- Account Renewal & Upsell Pipeline:Usage Audit → Renewal Quote → SLA Expansion → Renewed.
BizzField CRM enables teams to create and manage multiple named pipelines with custom stage rules, ensuring every deal follows its natural commercial path.
6. Automated Sales Forecasting & Reporting
With every opportunity tagged by stage, value, owner, and probability, data flows automatically into BizzField's Sales Forecasting Engine and 14 built-in analytics reports — providing real-time executive visibility without manual spreadsheet consolidation.
Supercharge Your Sales Pipeline Today
Frequently asked questions
A sales pipeline is the sequence of stages a deal moves through from first contact to close — for example Lead In, Qualified, Proposal Sent, Negotiation, Won, and Lost. Pipeline management means defining those stages, tracking each open deal's position, and using that view to forecast revenue.
A flat list tells you what deals exist; a Kanban pipeline tells you what is stuck. Grouping deals into columns by stage lets a manager spot in seconds that deals have been sitting in one stage too long, which is hard to catch scanning rows in a spreadsheet.
It multiplies each deal's amount by its win probability at its current stage, then sums the results — a more honest figure than the raw pipeline total, which assumes every deal closes. BizzField's Kanban cards show both the deal amount and the probability-weighted Expected Value.
Yes. You can configure multiple named pipelines, each with its own reorderable stages and its own Won/Lost terminal stages, with one set as the team default — useful when renewals and new business follow different paths.
WRITTEN BY
BizzField Sales Desk
Sales Strategy
The BizzField Sales Desk shares practical playbooks on pipeline management, lead handling and closing more deals.
Connect on LinkedIn