

BizzFieldCRM

REPORTS & ANALYTICS

14 Reports That Answer Real Sales Questions. Not A Blank Pivot Table.

BizzField CRM ships with 14 purpose-built reports spanning pipeline health, revenue forecasting, rep performance and account growth — grouped into categories, permissioned by role, and refreshed directly from live CRM data.

Bizzfield CRM
Dashboard
Reports
Pipeline
Forecast
Stalled Deals
Settings

REPORTS OVERVIEW

Reports Available
14
▲ 2 categories
Stalled Deals Flagged
6
▲ Past SLA, West zone
Forecasted Revenue
₹2.4Cr
▲ Probability-weighted
TrendThis Quarter
Recent Report Activity
Revenue Forecast refreshed from live pipeline2h ago
Stalled Deals flagged 6 opportunities5h ago
Sales Rep Performance exported1d ago
Win/Loss Analysis recalculated1d ago
14Built-in reports covering pipeline to revenue
2Report categories for fast navigation
4Currencies reflected across every report
100%Reports with independent view/export permissions
THE PROBLEM

Every Report Starts With An Export

Without built-in reporting, every question a sales leader asks turns into a spreadsheet project instead of a dashboard tile.

Weekly exports become a habit: CRM data gets pulled into Excel just to build a pipeline summary.
Leaderboards are rebuilt by hand: rep performance numbers get chased from multiple owners every cycle.
Stalled deals go unnoticed: there's no consistent way to spot deals that have gone quiet until it's too late.
Forecasts are guesswork: revenue projections get stitched together from open opportunities manually.
Access is all-or-nothing: export or view rights to sensitive numbers aren't tied to a role.
Numbers go stale between refreshes: a Monday export is already wrong by Wednesday's pipeline review.
FEATURE BY FEATURE

How BizzField CRM Solves It

Four capabilities that turn 14 built-in reports into a system leadership actually trusts, without a single export.

01

Every Report Maps To A Real Sales Question

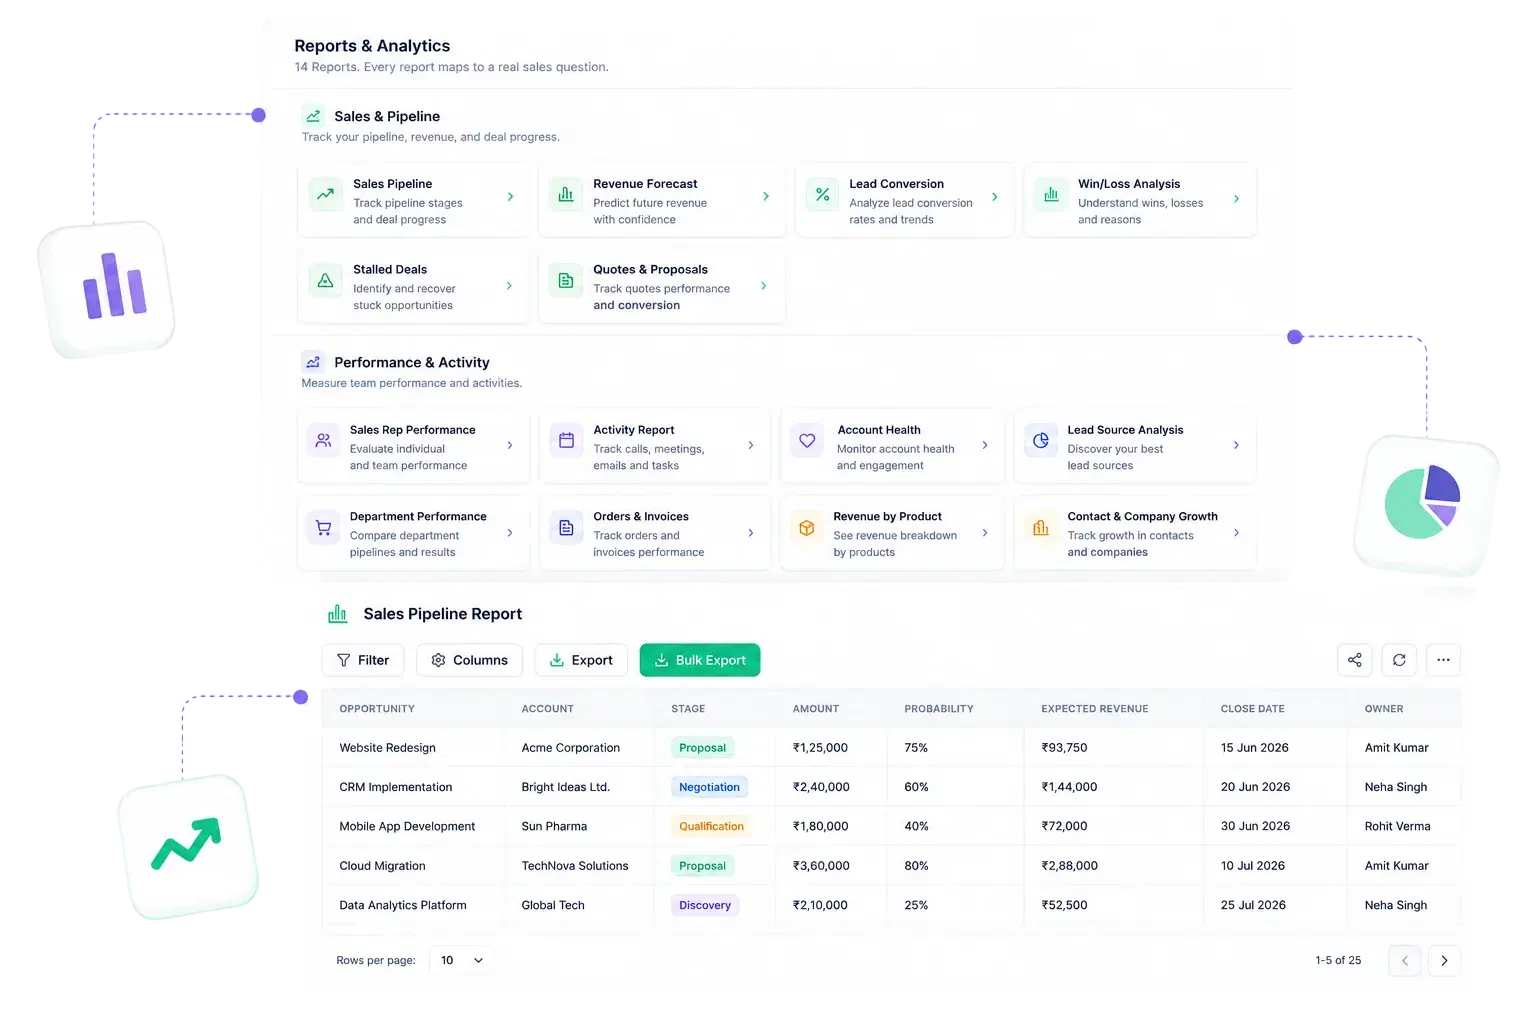
14 Reports, Grouped Into Categories
14 Reports, Grouped Into Categories

Reports are organized into categories within Reports & Analytics, so reps and managers find the right one fast instead of hunting through a flat list.

14 named reports: Sales Pipeline, Revenue Forecast, Lead Conversion, Sales Rep Performance, Activity, Win/Loss Analysis, Stalled Deals, Quotes & Proposals, Account Health, Revenue by Product, Lead Source Analysis, Department Performance, Orders & Invoices, Contact & Company GrowthReports are grouped into Sales & Pipeline and Performance & Activity categoriesEach report is purpose-built, not a generic pivot table over raw CRM tables
02

Two Reports That Replace A Spreadsheet And A Friday Afternoon

Forecasting And Deal-Risk Built In
Forecasting And Deal-Risk Built In

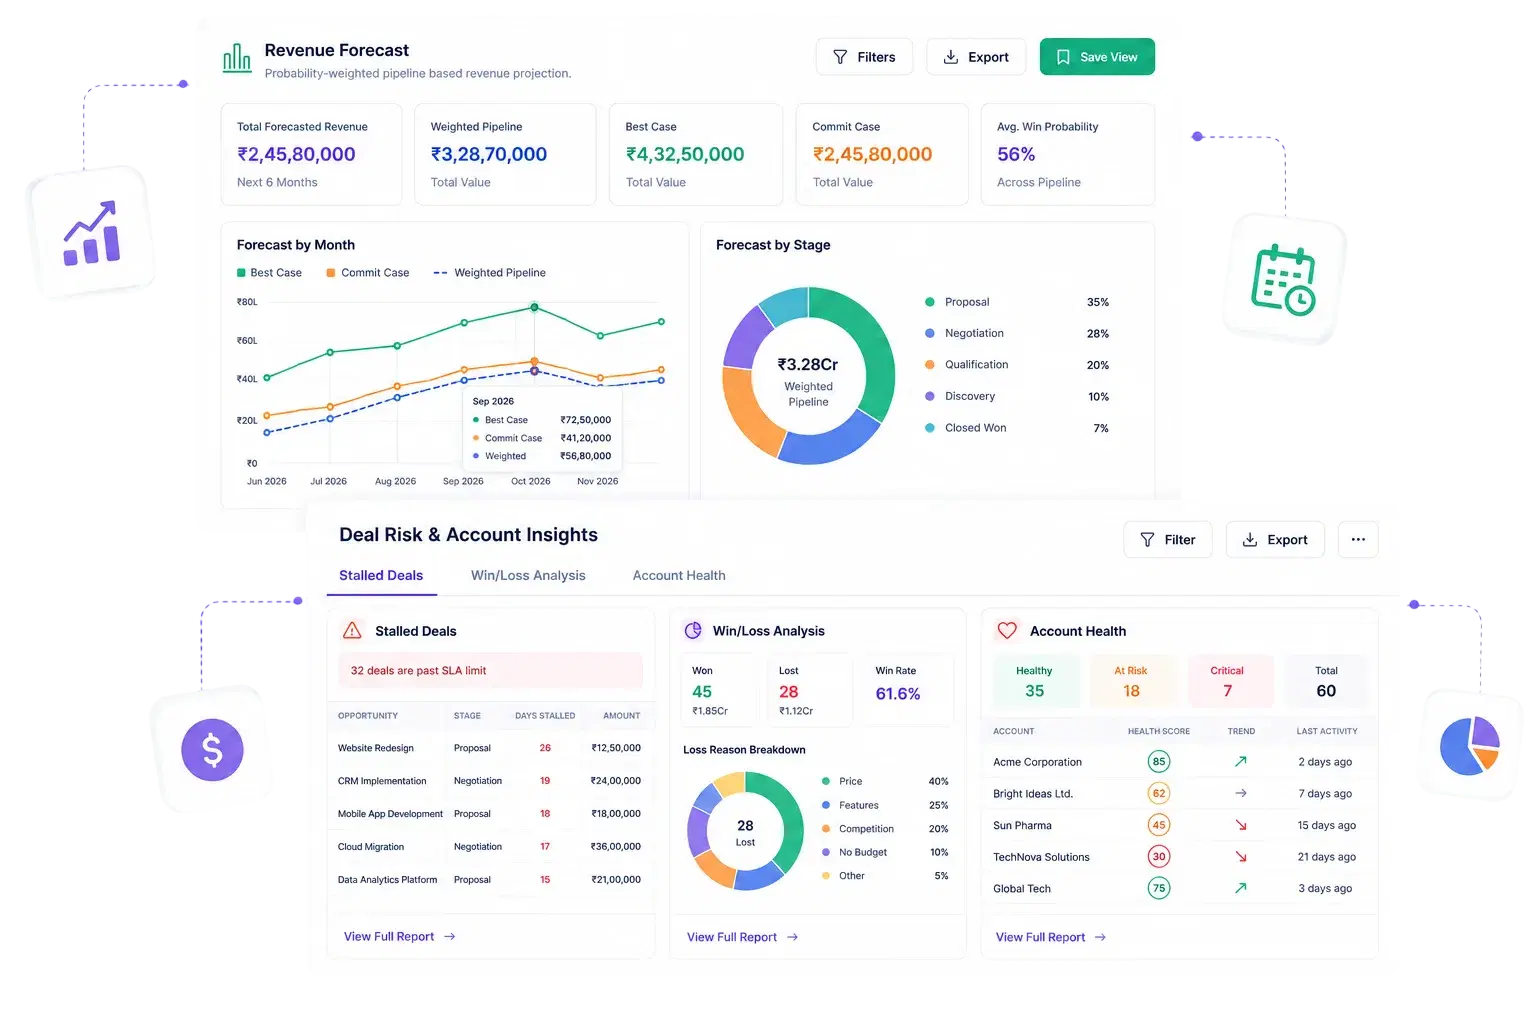
Revenue projection and deal-risk flagging run automatically from live pipeline data instead of a manual rollup, and surface on the dashboard the moment they change.

Revenue Forecast report projects monthly revenue from probability-weighted opportunity values and expected close datesStalled Deals report surfaces opportunities that have sat past your defined SLA limitWin/Loss Analysis report breaks down outcomes using the structured Loss Reason captured on every lost opportunityAccount Health report rolls up account-level signal for renewal and expansion conversations
03

Reporting Follows The Same Permission Engine As The Rest Of The CRM

Role-Based Access, Report By Report
Role-Based Access, Report By Report

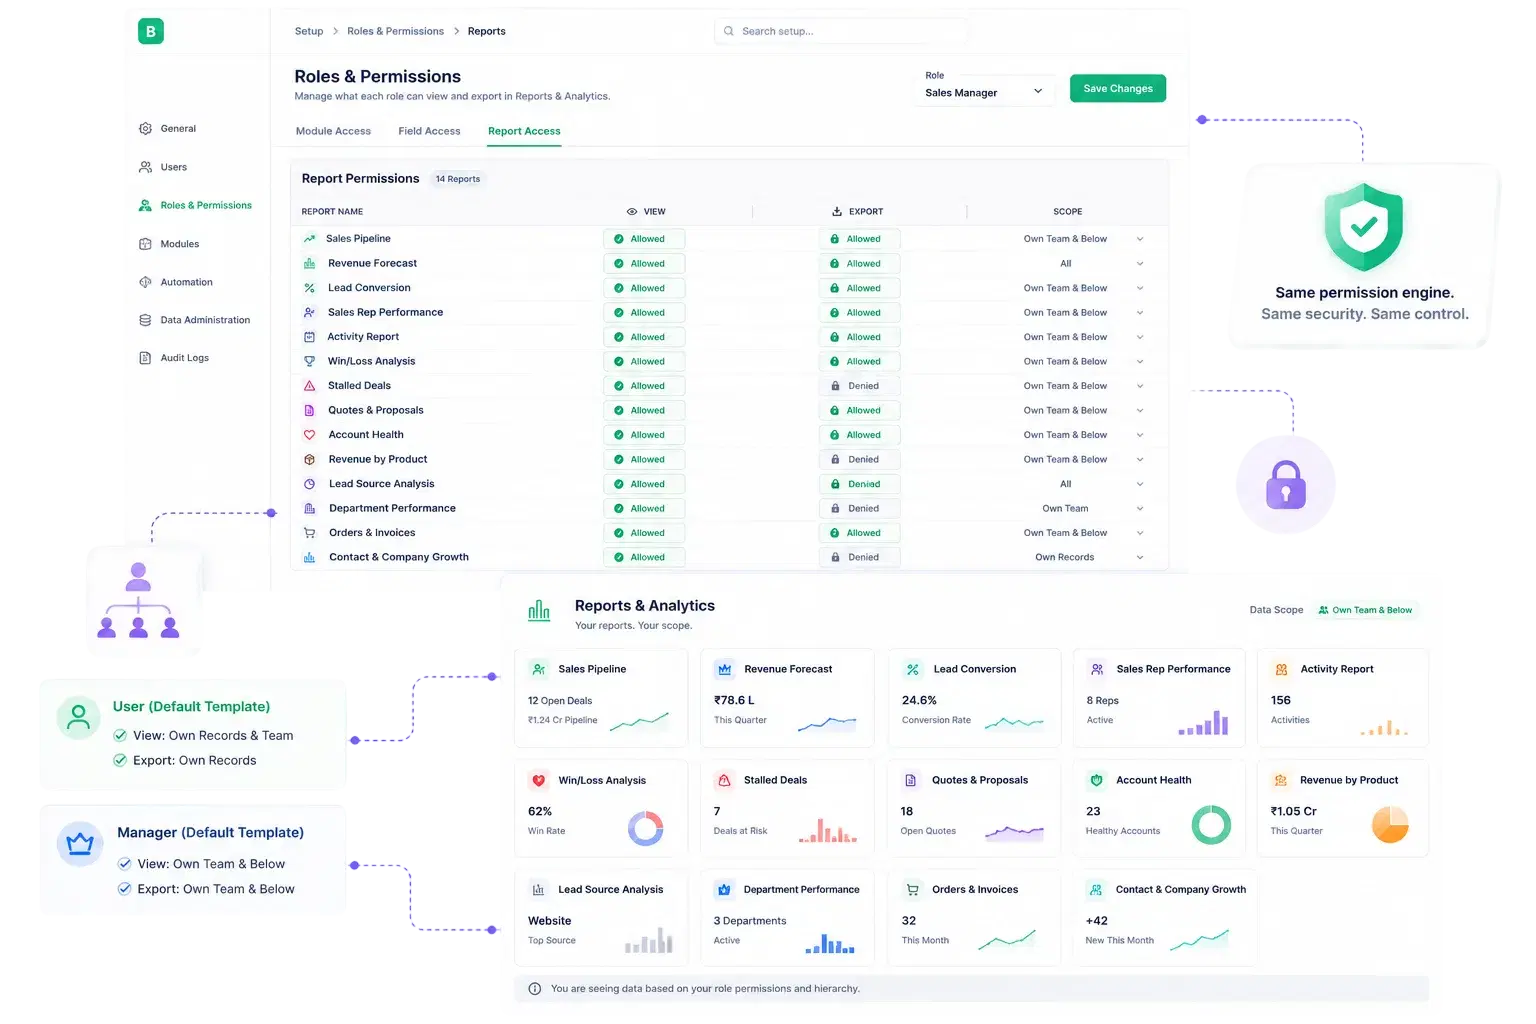
Reporting access is governed by the same Roles & Permissions system that controls every other module, not a separate admin panel.

Independent View and Export permission set per report, per roleAll 14 reports are permissioned separately, not as one bundled 'Reports' moduleBuilt-in User and Manager role templates come with sensible defaults out of the boxHierarchy-aware visibility means dashboard tiles reflect a user's own scope
04

Reports Read Straight From The Records Your Team Already Works In

Where The Numbers Come From
Where The Numbers Come From

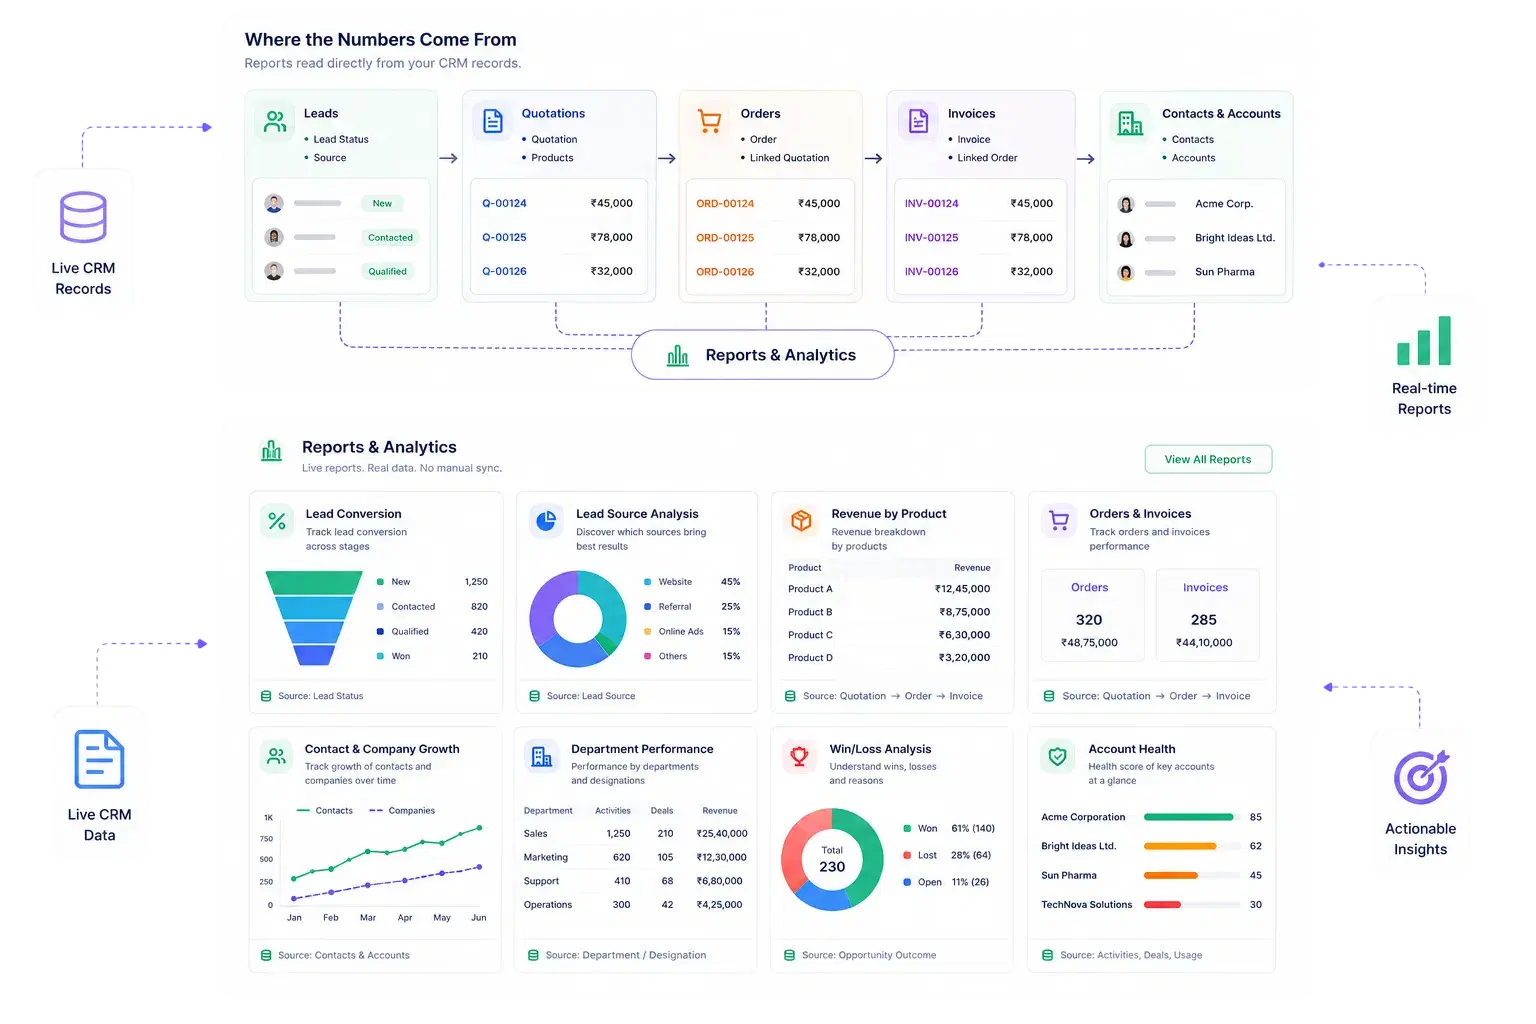
Every report is sourced from live CRM records, so the dashboard needs no separate sync or manual reconciliation.

Lead Conversion and Lead Source Analysis pull from the Lead Status workflow and Source fieldRevenue by Product and Orders & Invoices trace the quotation-to-order-to-invoice chainContact & Company Growth tracks Contact and Account creation over timeDepartment Performance rolls up activity using your Department/Designation master data
WHY BIZZFIELD

Why Sales Leaders Trust BizzField Reporting

Built from real sales questions, permissioned by role, and refreshed from live pipeline data.

Built From Real Sales QuestionsEach of the 14 reports answers a specific question a sales leader asks, not a generic drag-and-drop report builder you have to configure yourself.
Stalled Deals, Not Just Open DealsThe Stalled Deals report flags opportunities stuck past your SLA limit directly on the dashboard, so risk surfaces before a deal quietly dies in the pipeline.
Report Access Follows Your Role EngineView and Export permissions are set independently for every single report, using the same Roles & Permissions system that governs the rest of the CRM.
Forecasting From Real Pipeline DataThe Revenue Forecast report is built from probability-weighted opportunity values and expected close dates already in your pipeline, not a separate spreadsheet model.
Full Quote-To-Cash TraceabilityOrders & Invoices and Revenue by Product reports trace straight back through the quotation-to-order-to-invoice chain for a complete revenue picture.
Grouped For How Teams Actually WorkReports are organized into categories so pipeline-health tiles and team-output tiles are easy to tell apart and find quickly on the dashboard.
PROVEN RESULTS

Results. Not Promises.

What sales leadership sees once reporting stops being a manual export and starts living on the dashboard.

14Purpose-Built Reportsrefresh directly from live CRM data
2Report CategoriesSales & Pipeline, Performance & Activity
100%Reports With Role-Based Permissionsview and export set independently
0Manual Pivot Tables Requiredforecasts build from live pipeline data
HOW IT WORKS

From Raw Activity To A Dashboard Tile

Four steps, no exports. The same records your team works in every day are what leadership sees rendered live on the dashboard.

01Activity Is Captured Across The CRMLeads, Opportunities, Orders, Invoices and Tasks generate the data every report reads from.No separate data entry required for reportingReports reflect the same records reps work in daily
02Reports Refresh AutomaticallyEach of the 14 reports recalculates from live data and renders on dashboard tiles, with no manual pivot tables.Revenue Forecast built from probability-weighted valuesStalled Deals flagged against your SLA limit
03Role Permissions Gate AccessEvery report has its own View and Export permission, set per role, before a tile ever reaches a dashboard.Independent permissions per report, not one bundled moduleHierarchy-aware visibility scopes what each user sees
04Insight Drives The Next ActionLeadership acts on live dashboard numbers instead of a stale weekly export.Win/Loss Analysis and Account Health inform coaching and renewalsSales Pipeline and Revenue Forecast inform forecasting calls
FAQ

Reports & Analytics — Questions Sales Leaders Ask

BizzField ships with 14 built-in reports spanning pipeline health, revenue forecasting, rep performance, lead conversion and account growth, grouped into Sales & Pipeline and Performance & Activity categories.

Key numbers from reports like Revenue Forecast, Stalled Deals and Sales Rep Performance render live on dashboard tiles, refreshed from the same records reps work in daily, alongside the full report for anyone who needs to drill in.

Yes. Every report has its own View and Export permission, so you can grant analysts export access while limiting others to on-screen viewing on their dashboard.

It surfaces opportunities that have sat past your defined SLA limit, so a deal going quiet is flagged on the dashboard before it quietly dies in the pipeline rather than being discovered at month end.

It projects monthly revenue directly from probability-weighted opportunity values and expected close dates already in your pipeline — there is no separate spreadsheet model to maintain.

Yes, where your role has Export permission on that specific report. Export rights are set independently per report, not as a single all-or-nothing toggle.

See Your Pipeline On A Dashboard, Not In An Export

Most teams that book a demo see live Sales Pipeline, Revenue Forecast and Stalled Deals tiles pulled up in the same session — and immediately drop the Friday export ritual.