

BizzFieldCRM

DASHBOARD

Your Day Starts On One Screen. Not Seven Exports.

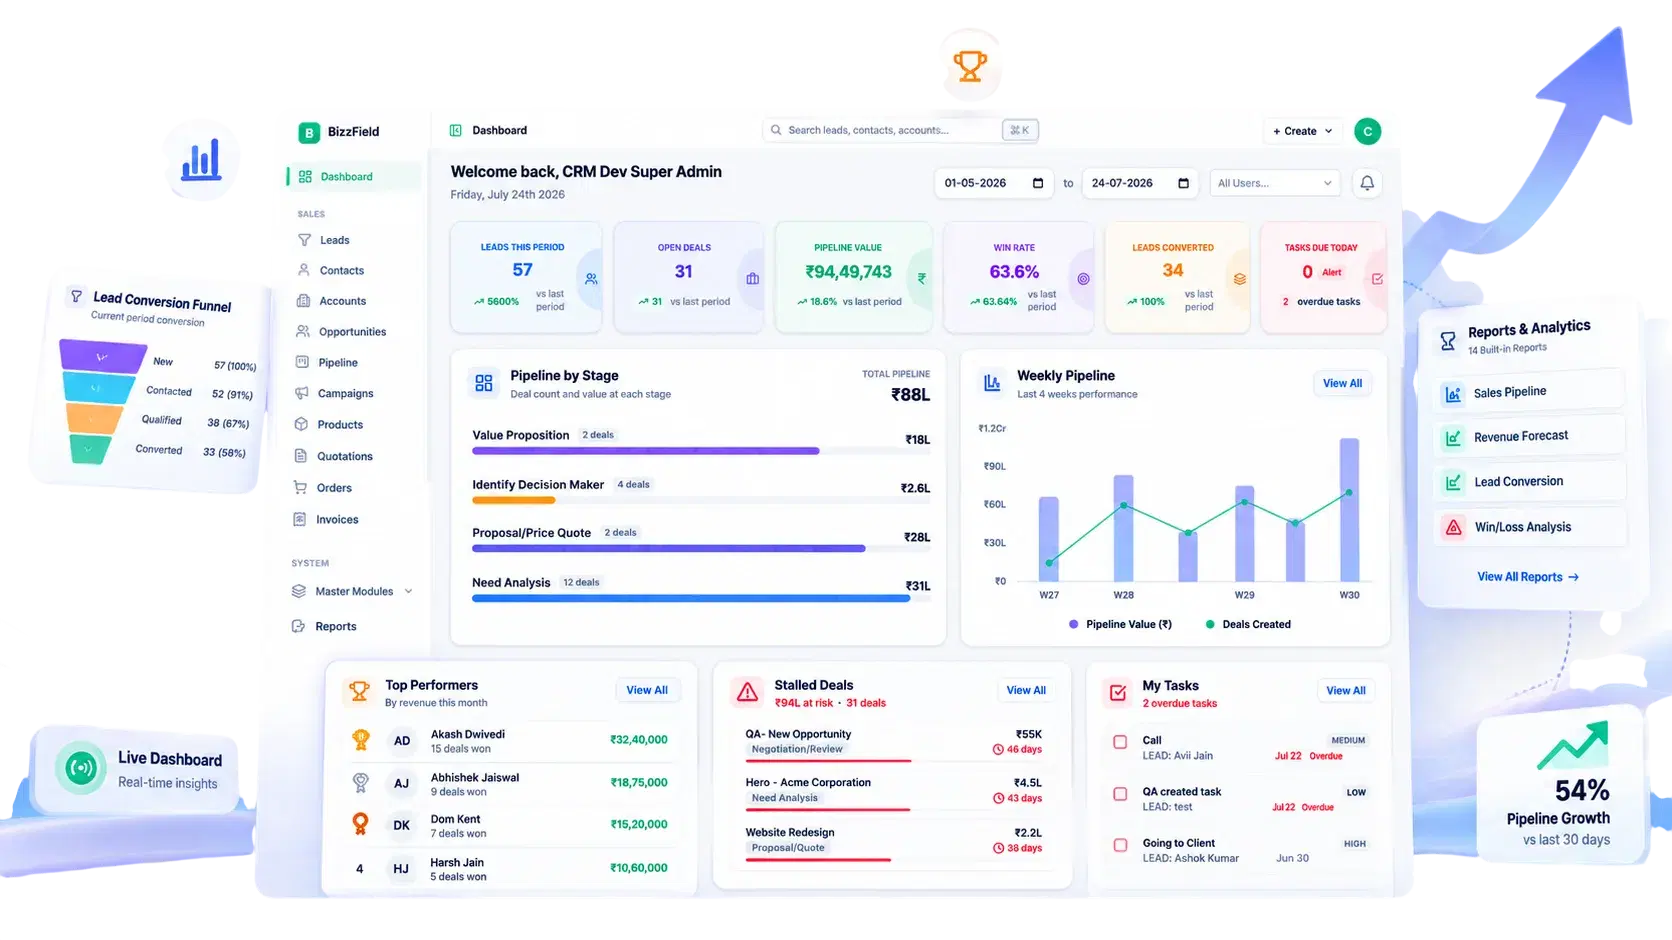
BizzField CRM's dashboard is a working home screen built from live KPI widgets — pipeline by stage, lead funnel, top reps, stalled deals, your tasks and today's meetings — with a drill-down page behind every number.
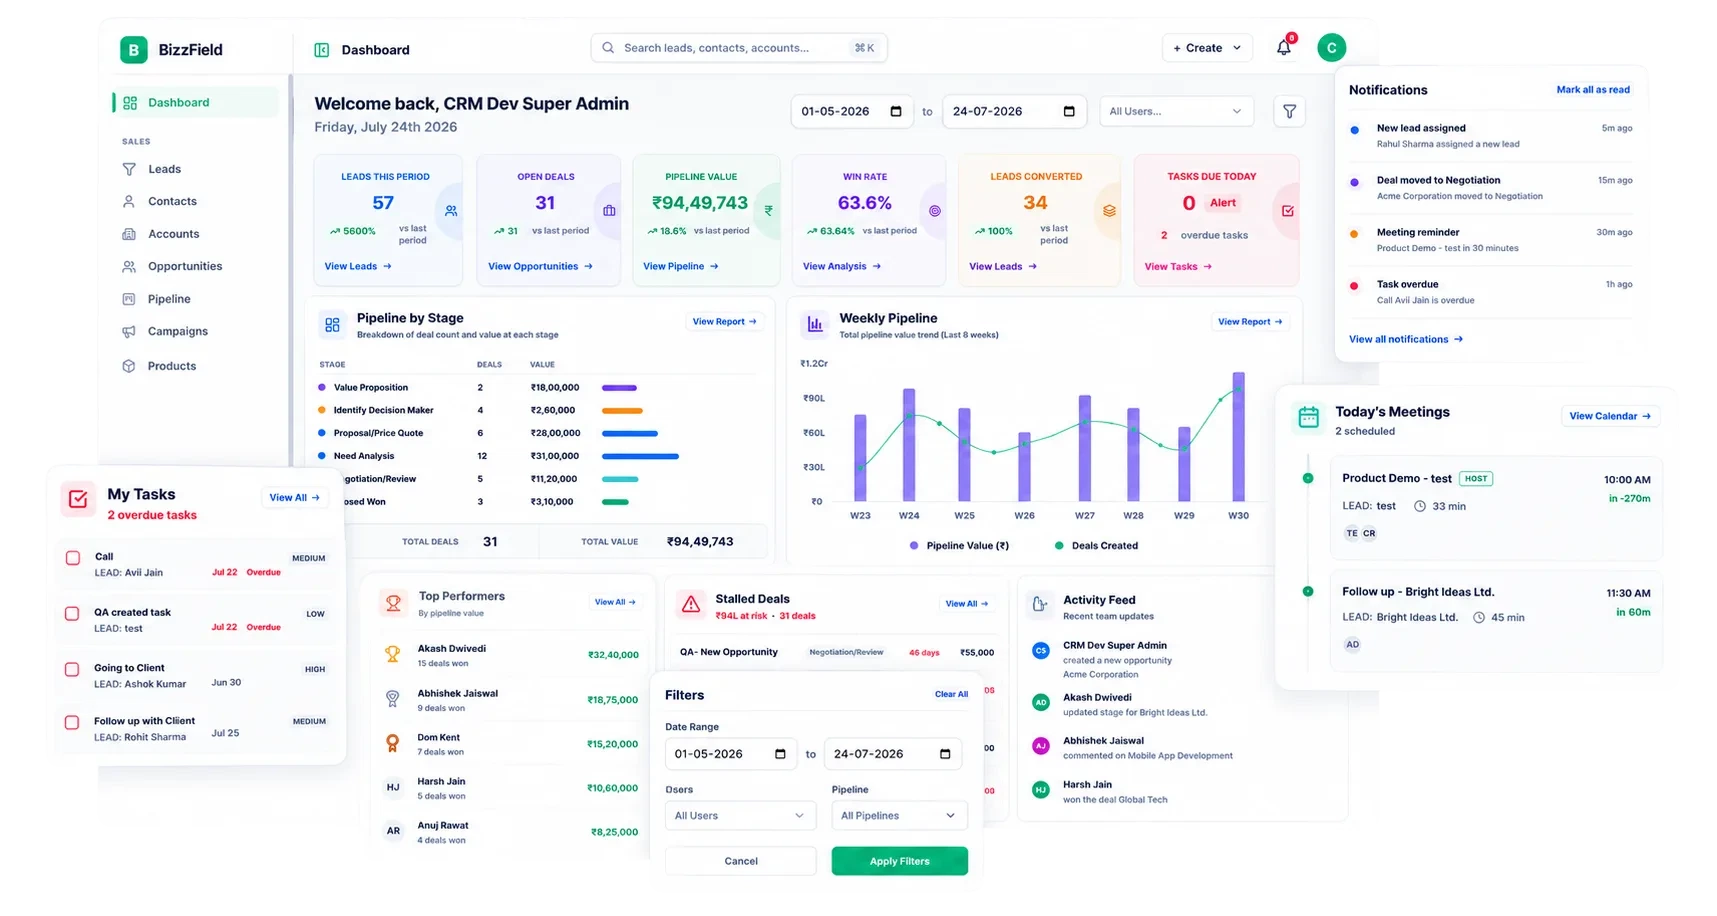
BizzField CRM dashboard showing pipeline value, deal stages, activity trends and team performance charts
7Live KPI widgets on one home screen
14Built-in reports one click behind every KPI
25+CRM modules feeding the dashboard
100%Responsive on desktop and mobile browsers
THE PROBLEM

Monday Morning Shouldn't Be A Pivot Table

Without a working home screen, every status check turns into a round of exports, pings, and re-shared spreadsheets.

Numbers come from separate exports: leads, deals and tasks each need their own pull before anyone sees the full picture.
Pipeline-by-stage means a pivot table: there's no live view of deal count and value at each stage.
Rep performance means pinging people: finding out who's ahead or behind takes individual messages.
Stalled deals hide in a spreadsheet tab: cold opportunities go unnoticed until someone digs for them.
Every new date range means a re-share: managers wait on a re-filtered file just to see a different window.
Tasks and meetings live somewhere else entirely: the start of the day means opening two more tools before opening the CRM.
FEATURE BY FEATURE

How BizzField CRM Solves It

Four capabilities that turn the dashboard into a working home screen, not a static report.

01

Every Metric Links Straight To The Records Behind It

KPI Cards That Go Beyond The Number
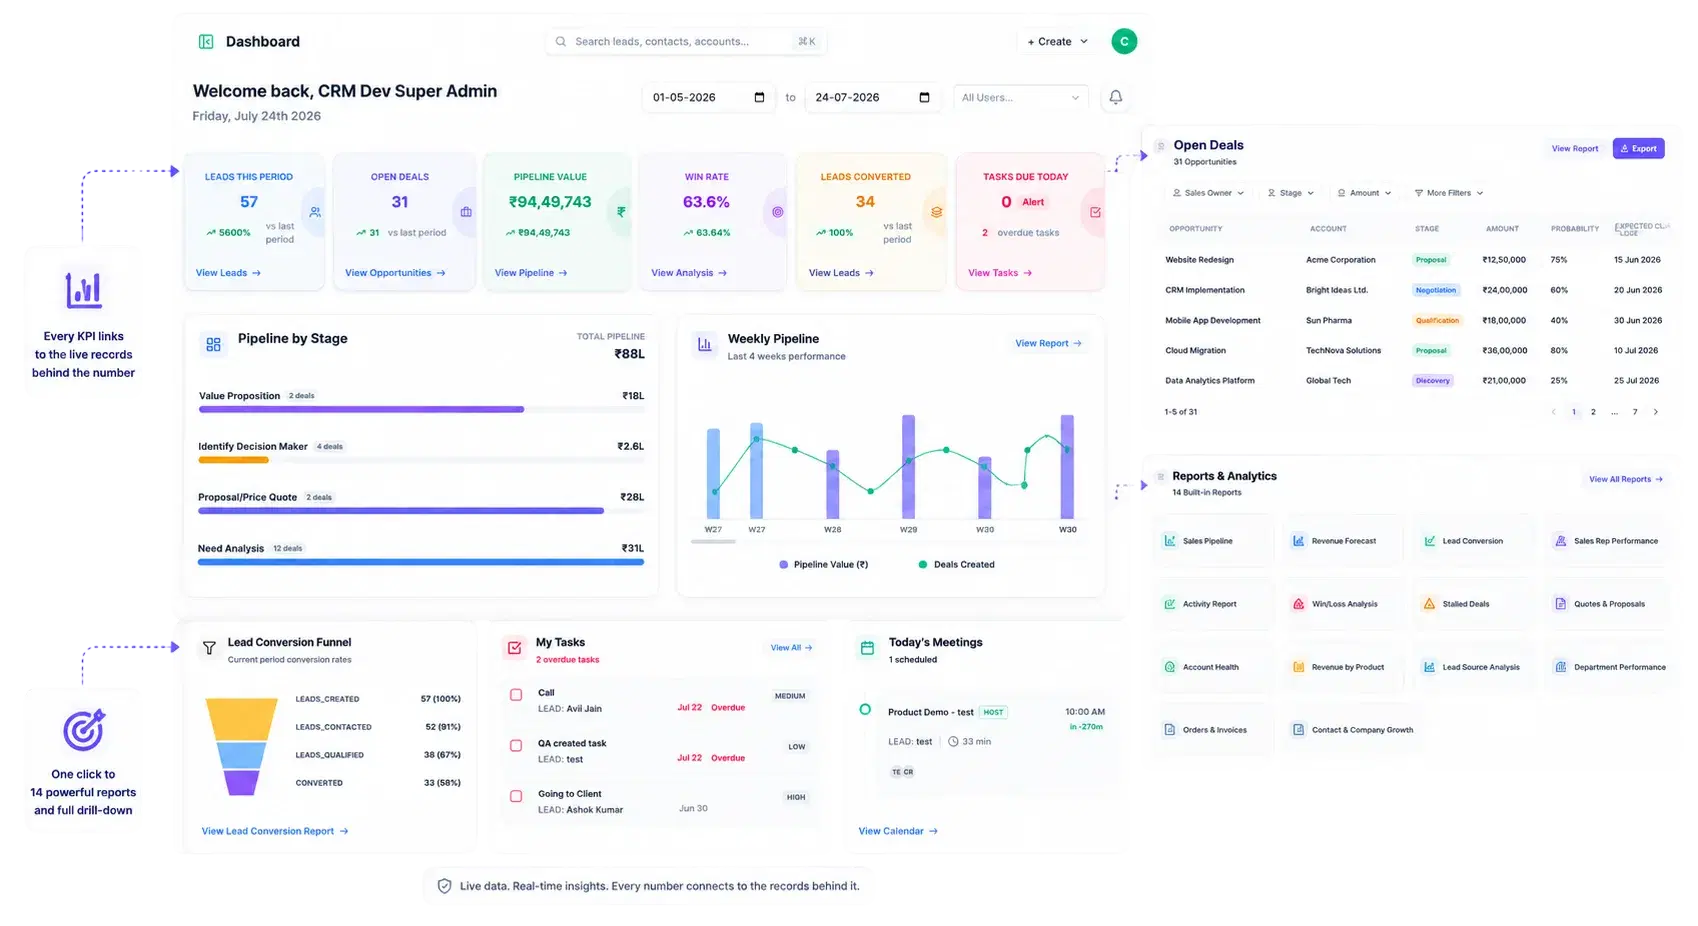
KPI Cards That Go Beyond The Number

Every headline metric on the dashboard is pulled live from Leads, Opportunities and Activities — and every card links straight into the records that make up the number, not just a static count.

KPI cards summarize live data pulled straight from Leads, Opportunities and ActivitiesEach card links to a dedicated drill-down detail page behind the numberPipeline-by-stage chart shows deal count and value at every stageWeekly pipeline chart tracks how pipeline value is trending week over week14 built-in reports sit one click behind the dashboard's KPI cards
PIPELINE & FUNNEL

Pipeline And Lead Funnel, Visualized Live

See deal count and value at every stage, and exactly where leads convert — or stall — on the way to Qualified.

01

See Deal Count And Value At Every Stage, Not Just The Total

Pipeline And Lead Funnel, Visualized Live
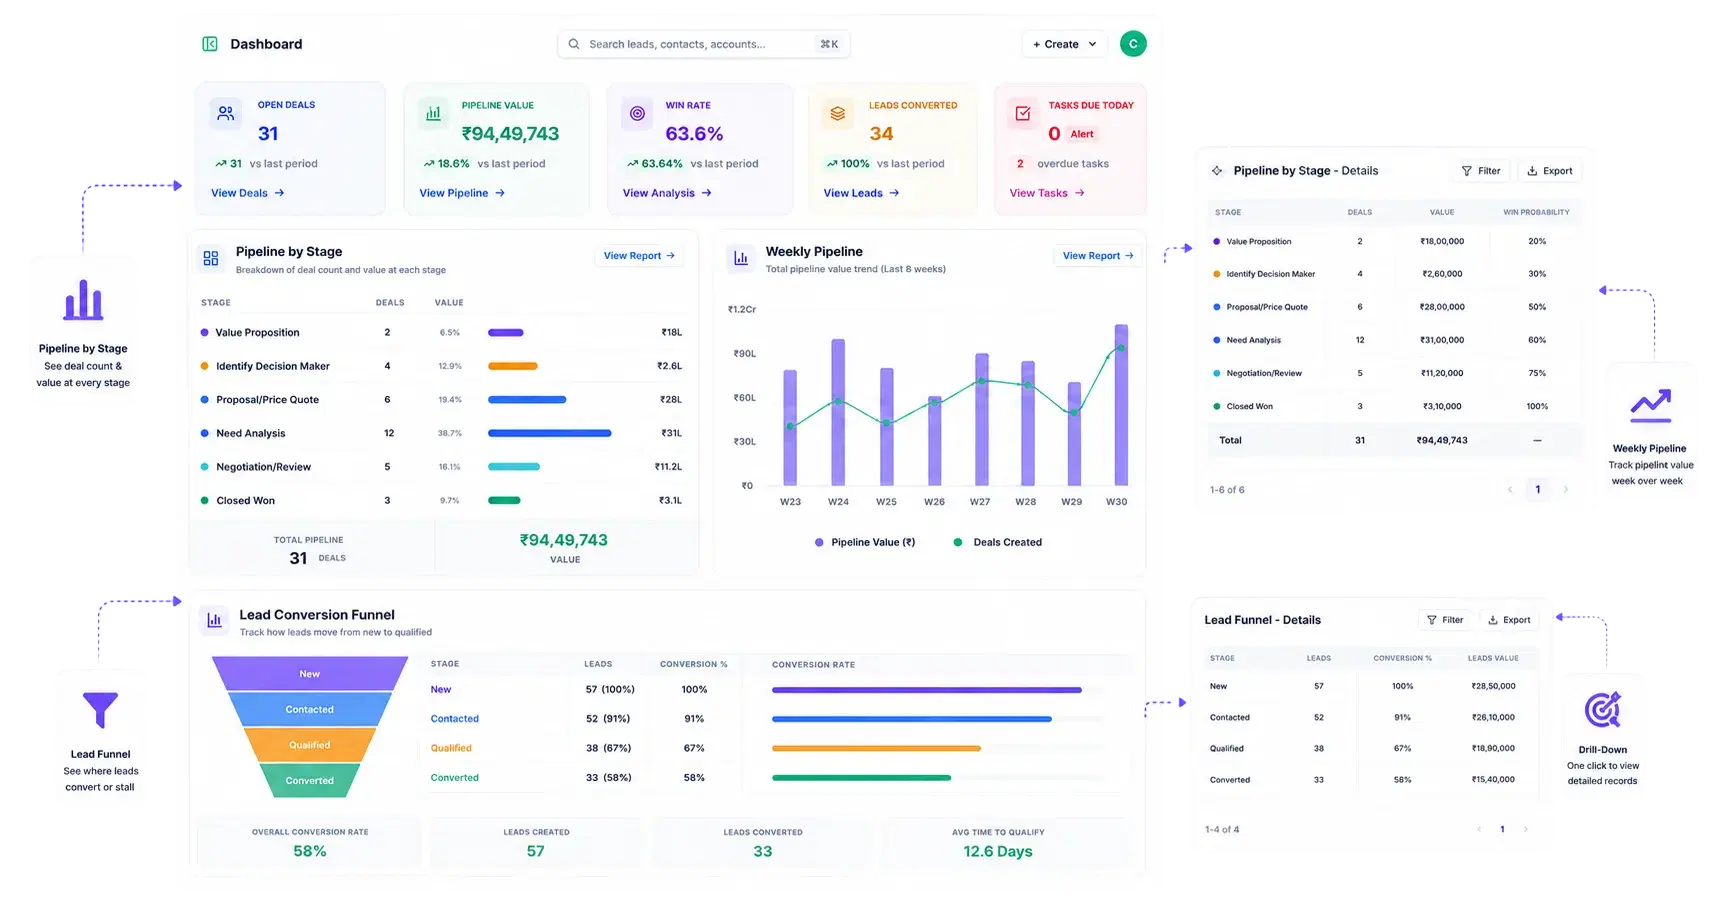
Pipeline And Lead Funnel, Visualized Live

The dashboard turns your pipeline into a live chart instead of a static total, and shows exactly where leads convert — or stall — on the way to Qualified.

Pipeline-by-stage chart breaks out deal count and value at every stageWeekly pipeline chart tracks how total pipeline value moves week over weekLead funnel widget visualizes conversion from New through Qualified in one viewBoth widgets pull from the same Opportunities and Leads records you work in daily
TEAM PERFORMANCE

Team Performance, Without The Pings

See who's ahead and which deals have gone quiet, scoped automatically to whoever is looking at the screen.

01

Top Reps And Stalled Deals, Surfaced Automatically

Team Performance, Without The Pings
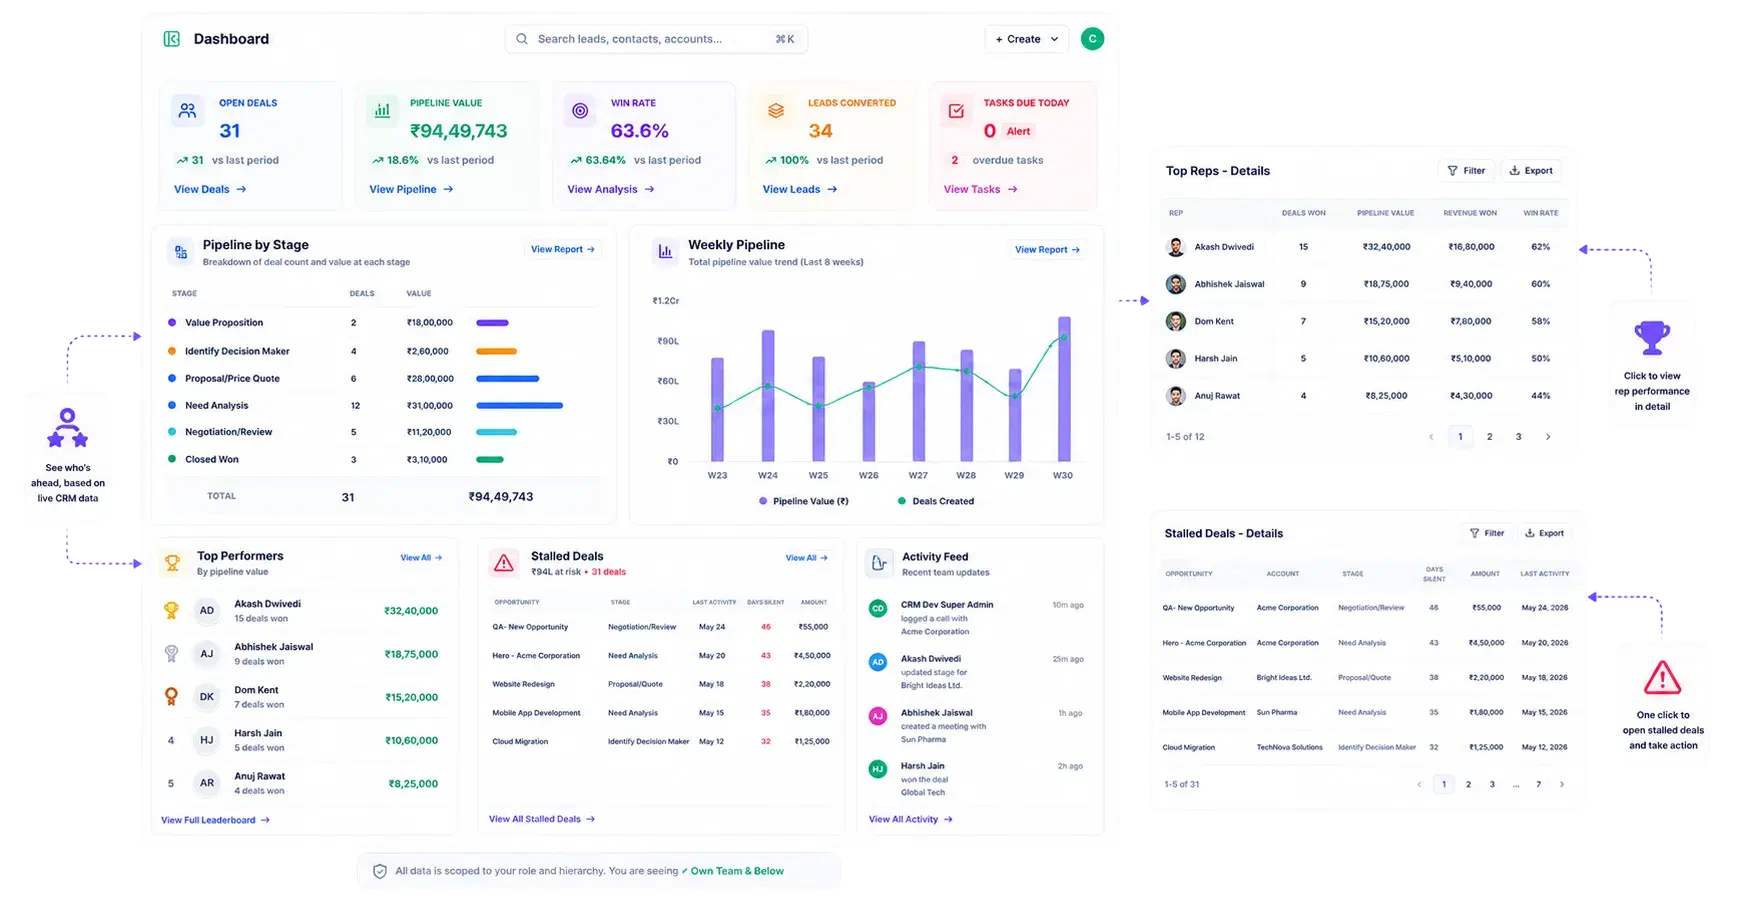
Team Performance, Without The Pings

Instead of messaging reps individually to check status, the dashboard surfaces who's ahead and which deals have gone quiet — scoped to whoever is looking at it.

Top Reps widget highlights performance leaders directly on the home screenStalled Deals widget flags opportunities that have gone quiet before they're forgottenAll widgets respect hierarchy-based data visibility — a rep sees their own numbers, a manager sees their team'sNo manual access list or side spreadsheet required to scope who sees what
THE WORKDAY

Built For The Start Of The Workday, Not Just A Report

Tasks and meetings sit next to your KPIs, filters reshape the whole screen instantly, and a notification layer keeps it current.

01

Tasks, Meetings, Filters And Alerts On The Same Screen

Built For The Start Of The Workday, Not Just A Report
Built For The Start Of The Workday, Not Just A Report

The dashboard is a working home screen: tasks and meetings sit next to KPIs, filters reshape every widget instantly, and a lightweight notification layer keeps it current across the whole team.

'My Tasks' widget puts each user's open tasks front and center on login'Today's Meetings' widget lists the day's scheduled meetings without navigating awayDate-range filter scopes every widget to the period that mattersMulti-user filter lets managers view KPIs for a specific rep, a team, or everyoneUnread-alerts indicator on the header bell icon flags new activityFully responsive — identical widgets and permissions on desktop and mobile browsers
WHY BIZZFIELD

Why Sales Teams Start Their Day Here

Real widgets backed by live data, scoped to your hierarchy, with insight and action side by side.

Real Widgets, Not Static TilesEvery KPI card, chart and widget is backed by live CRM data with a drill-down page behind it, not a hardcoded summary.
Built For Hierarchies, Not Just IndividualsMulti-user filtering and hierarchy-aware visibility mean a rep, a manager and a director see the same dashboard scoped correctly to their role.
Connected To The Pipeline You Actually Work InPipeline-by-stage charts and Stalled Deals widgets reflect the same opportunities and stages you manage on the Kanban board.
Action Items Alongside InsightsMy Tasks and Today's Meetings sit next to your KPIs, so the dashboard is a starting point for the day, not just a report to glance at.
One Click Deeper Into Any NumberDrill-down detail pages behind every KPI card mean you never have to ask what's actually in that number.
No App To Install, No Context To LoseThe dashboard runs in any mobile or tablet browser with the same widgets and permissions as desktop.
PROVEN RESULTS

Results. Not Promises.

What sales teams see once the morning status check stops living in a spreadsheet.

7Live KPI Widgetspipeline, funnel, tasks, meetings and more
14Reports One Click Behind Every KPIdrill-down without leaving the dashboard
25+CRM Modules Feeding Live Datano exports, no manual refresh
100%Responsive On Desktop And Mobilesame widgets, same permissions
FAQ

Dashboard — Questions Sales Teams Ask

Yes. The dashboard header includes a date-range filter and a multi-select user filter so managers can view any rep or time window.

Yes. Clicking through a KPI card opens a dedicated drill-down page with the underlying records for that metric.

Yes. The 'My Tasks' and 'Today's Meetings' widgets sit alongside the KPI cards, so the dashboard is a working home screen for the day, not only a reporting surface.

Yes. The dashboard is fully responsive and works identically in any mobile or tablet browser, with the same widgets and permissions as desktop — no separate app to install.

The dashboard includes seven live widgets: pipeline-by-stage, weekly pipeline trend, lead funnel, My Tasks, Today's Meetings, Top Reps and Stalled Deals.

Every widget applies hierarchy-based data visibility automatically, so a rep sees their own numbers, a manager sees their team's, and a director sees the rollup — without any manual sharing setup.

See Your Team's Morning Standup On One Screen

Most teams that book a demo watch pipeline, tasks and stalled deals load on one dashboard in real time — and immediately see how much of their weekly export ritual it replaces.